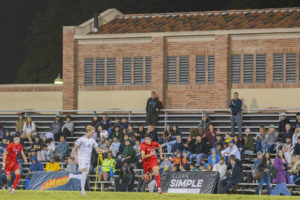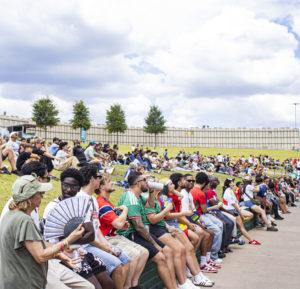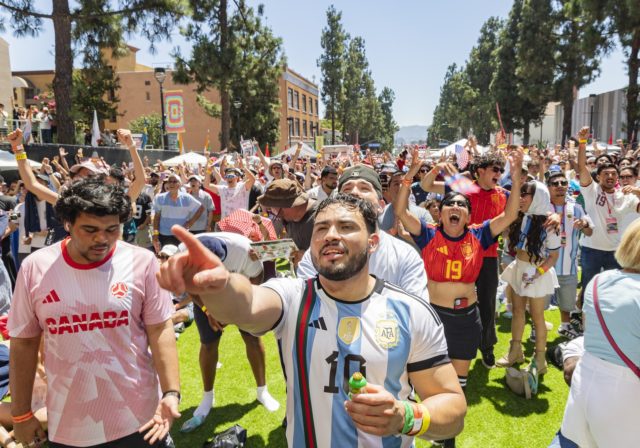
The FIFA World Cup returned in 2026 to Los Angeles for the first time since 1994. As one of the tournament’s host cities, LA hosted eight matches at SoFi Stadium, including the opening match for the U.S. men’s national team.
Beyond the excitement surrounding the tournament’s return, the World Cup’s arrival in Los Angeles offers a chance to examine how the game has changed since the city last hosted it more than three decades ago. The Stack analyzed nearly a century of World Cup match data, from the inaugural 1930 World Cup tournament in Uruguay through the expanded 2026 competition, to explore how scoring, competitiveness and playing style have evolved – and how the games played in LA this year compare to the ones fans watched in 1994.
How have the fundamentals changed?
Since the first tournament in 1930, the competition has expanded in both size and global reach. Attendance has climbed, matching larger stadiums and increased participation, while the way matches are played has shifted considerably.
Source: FIFA. Graphic reporting and interactive by Madison Jones, Stack developer.
Early matches were substantially higher-scoring, with the 1954 tournament in Switzerland reaching almost six goals per match – the highest in World Cup history. Scoring has since settled into a narrower range, with every tournament since 1998 averaging fewer than three goals per match, including 2.96 in 2026
While scoring has become more consistent, discipline against fouls has evolved differently. Yellow cards became increasingly common after their introduction in 1970, rising from almost two per match that year to a peak of five in 2006. Since then, that rate has generally fallen, with an average of three yellow cards given out in each match in 2026. Red cards, often called send-offs, show a similar shift from the particularly card-heavy tournaments around the turn of the century. The 2006 World Cup recorded 0.41 send-offs per match, compared with 0.15 in 2026. The 2006 tournament stands out as an especially card-heavy outlier, while the modern World Cup has seen fewer send-offs despite maintaining a similar level of scoring
Attendance, meanwhile, illustrates the scale the tournament has reached.
The strongest comparison is 2026 vs. 2022, as well as the attendance record from 1994. The 2026 World cup averaged 65,490 spectators per match, roughly 23% higher than the 53,131 per-match average recorded in Qatar in 2022. That puts 2026 within striking distance of FIFA’s all-time attendance record: the 1994 World Cup in the U.S.
The 1994 World Cup in the U.S. remains the most-watched tournament since inauguration on a per-match basis, averaging nearly 69,000 spectators. Despite staging nearly twice as many games as the 1994 tournament, the expanded 2026 tournament came close, drawing around 65,490 spectators per match.
The World Cup returns to LA
More than three decades after hosting matches at the Rose Bowl, LA welcomed the FIFA World Cup once again in 2026 – this time at SoFi Stadium. Although the tournament expanded from 24 teams in 1994 to 48 teams in 2026, LA remained one of the few cities to have hosted matches in both editions.
The network below highlights that connection. While the tournament has evolved on the pitch, LA has remained part of its history, linking two very different eras of World Cup soccer.
Source: FIFA. Graphic reporting and interactive by Madison Jones, Stack developer.
In 1994, the U.S. hosted the World Cup across nine venues, with 24 teams competing in 52 matches. The tournament opened at Soldier Field in Chicago and concluded at the Rose Bowl in LA – the tournament’s largest venue – which held more than 100,000 spectators.
The 2026 World Cup returned to the U.S. on a much larger scale. Rather than being hosted by one country, the tournament was played across North America, with 11 host cities in the U.S., three in Mexico and two in Canada. The number of participating teams doubled from 24 in 1994 to 48 in 2026, while the number of matches increased from 52 to 104. LA returned as a host city, this time staging eight matches at SoFi Stadium, including the U.S. team’s opening match. Unlike 1994, however, the World Cup final was played at MetLife Stadium in East Rutherford, New Jersey, rather than LA.
LA County is expected to see about $892 million in economic impact from the World Cup, with the region’s long-term economic benefits projected to surpass $1.1 billion, according to the FIFA committee.
From opportunity to outcome
Creating chances is only one part of winning soccer matches. Teams also need to convert those opportunities into goals. Expected goals (xG) estimate the quality of every shot based on historical scoring probabilities, providing a benchmark for how many goals a team would be expected to score given the chances it created. Comparing actual goals with expected goals highlights which teams finished efficiently and which underperformed.
Source: FIFA. Graphic reporting and interactive by Madison Jones, Stack developer.
Most teams cluster close to the diagonal, indicating that their goal totals closely matched the quality of the chances they created. A handful of teams stand out above the line, outperforming their expected goal totals through efficient finishing, while teams below the line generated opportunities that ultimately produced fewer goals than expected.
Expected goals closely tracked actual scoring throughout the tournament, with a correlation of 0.94 between teams’ total expected goals and goals scored. Still, several teams finished well above or below what the quality of their scoring chances would suggest.
England stood out the most, scoring seven goals more than expected – the largest positive gap in the tournament – for a total of 20 goals. Morocco and the U.S. were also among the most efficient finishers, scoring 11 goals apiece from 6.73 and 7.01 expected goals, respectively. On the opposite end, Colombia saw the largest difference, scoring only five times despite generating 8.56 expected goals.
Nearly a century of changing scorelines
Since LA last hosted the World Cup in 1994, tournament expansion has brought more teams onto the global stage, while advances in coaching, analytics and player development have reshaped how teams prepare for international competition.
But expansion has not necessarily meant wider gaps between teams. The average goal margin in each tournament, the share of matches decided by three or more goals and the percentage of goals scored during the closing stages of matches, offer a look at how closely World Cup teams have competed over time. Together, these metrics capture whether games have become closer, whether one-sided blowouts are becoming less common and whether teams are remaining competitive deeper into matches.
Source: FIFA. Graphic reporting and interactive by Madison Jones, Stack developer.
The first trend shows that World Cup matches have generally become more balanced in score margins over time. Early tournaments often featured wide scorelines, with average goal differences sometimes exceeding two goals per match. Since the 1960s, those margins have remained much lower. The 2026 tournament, however, broke slightly from this trend, with an average goal difference of 1.55 goals per match, 16% higher than the 1.34 average across the seven World Cups from 1998 to 2022.
Blowouts followed a similar pattern. Matches decided by three or more goals became less common over time, but increased in 2026. About 21.4% of matches were decided by at least three goals, compared with 14.5% during the 32-team era, a 6.9 percentage-point increase.
Late scoring was also relatively common in 2026. About 28.4% of goals were scored from the 76th minute onward, compared with 26.1% during the 32-team era. This was the fifth-highest late-goal share among the 23 World Cups analyzed. Together, the measures suggest that while World Cup matches became more competitive over time, the 2026 tournament did not fully continue that trend.
Different paths to victory
Every national team brings a different approach to the World Cup. Some dominate possession, others rely on quick counterattacks and some succeed through disciplined defending. Across seven match statistics, clear similarities emerged between teams with comparable approaches. Teams located near one another on the map produced similar play profiles over the course of the tournament.
Source: FIFA. Graphic reporting and interactive by Madison Jones, Stack developer.
Many nations fell somewhere between those extremes. Japan, England and Switzerland, for example, occupied positions closer to the center of the chart, reflecting more balanced performances rather than an emphasis on a single style of play.
As LA welcomed the FIFA World Cup for the first time in more than three decades, it welcomed back a game that has changed considerably since 1994. Matches have become closer, playing styles have shifted and the tournament itself has grown to include more teams than ever before. The World Cup that returned to LA in 2026 may have carried the same global excitement, but the game on the field looked different from the one the city last hosted.
About the Data
The Stack analyzed historical FIFA World Cup match data from 1930 through 2022 with official statistics from the 2026 FIFA World Cup. The World Cup was not held from 1942 or 1946 because of World War II, so those years were not included. Historical match results were used to examine long-term trends in average goal margin, the share of matches decided by three or more goals and the proportion of goals scored during the final 15 minutes of regulation.
FIFA introduced yellow and red cards at the 1970 World Cup. Although referees could send players off before 1970, cautions were not indicated with yellow cards. As a result, yellow card rates are shown only from 1970 onward, while historical send-offs from 1930-1970 are included in red card rates.
For the 2026 tournament, match-level statistics, including possession, shots, shots on target, corners, fouls, offsides, saves and expected goals (xG), were compiled from FIFA and verified against publicly available match reports.