
From pastel to dark olive green, different neighborhoods across the Los Angeles area light up on an interactive online map. With the click of the “play” button on the map, a foliage of greens flashes on the screen, depicting changes in energy use over a period of 18 months. Read more...
Campus
Campus, News
|
April 9, 1:15 am
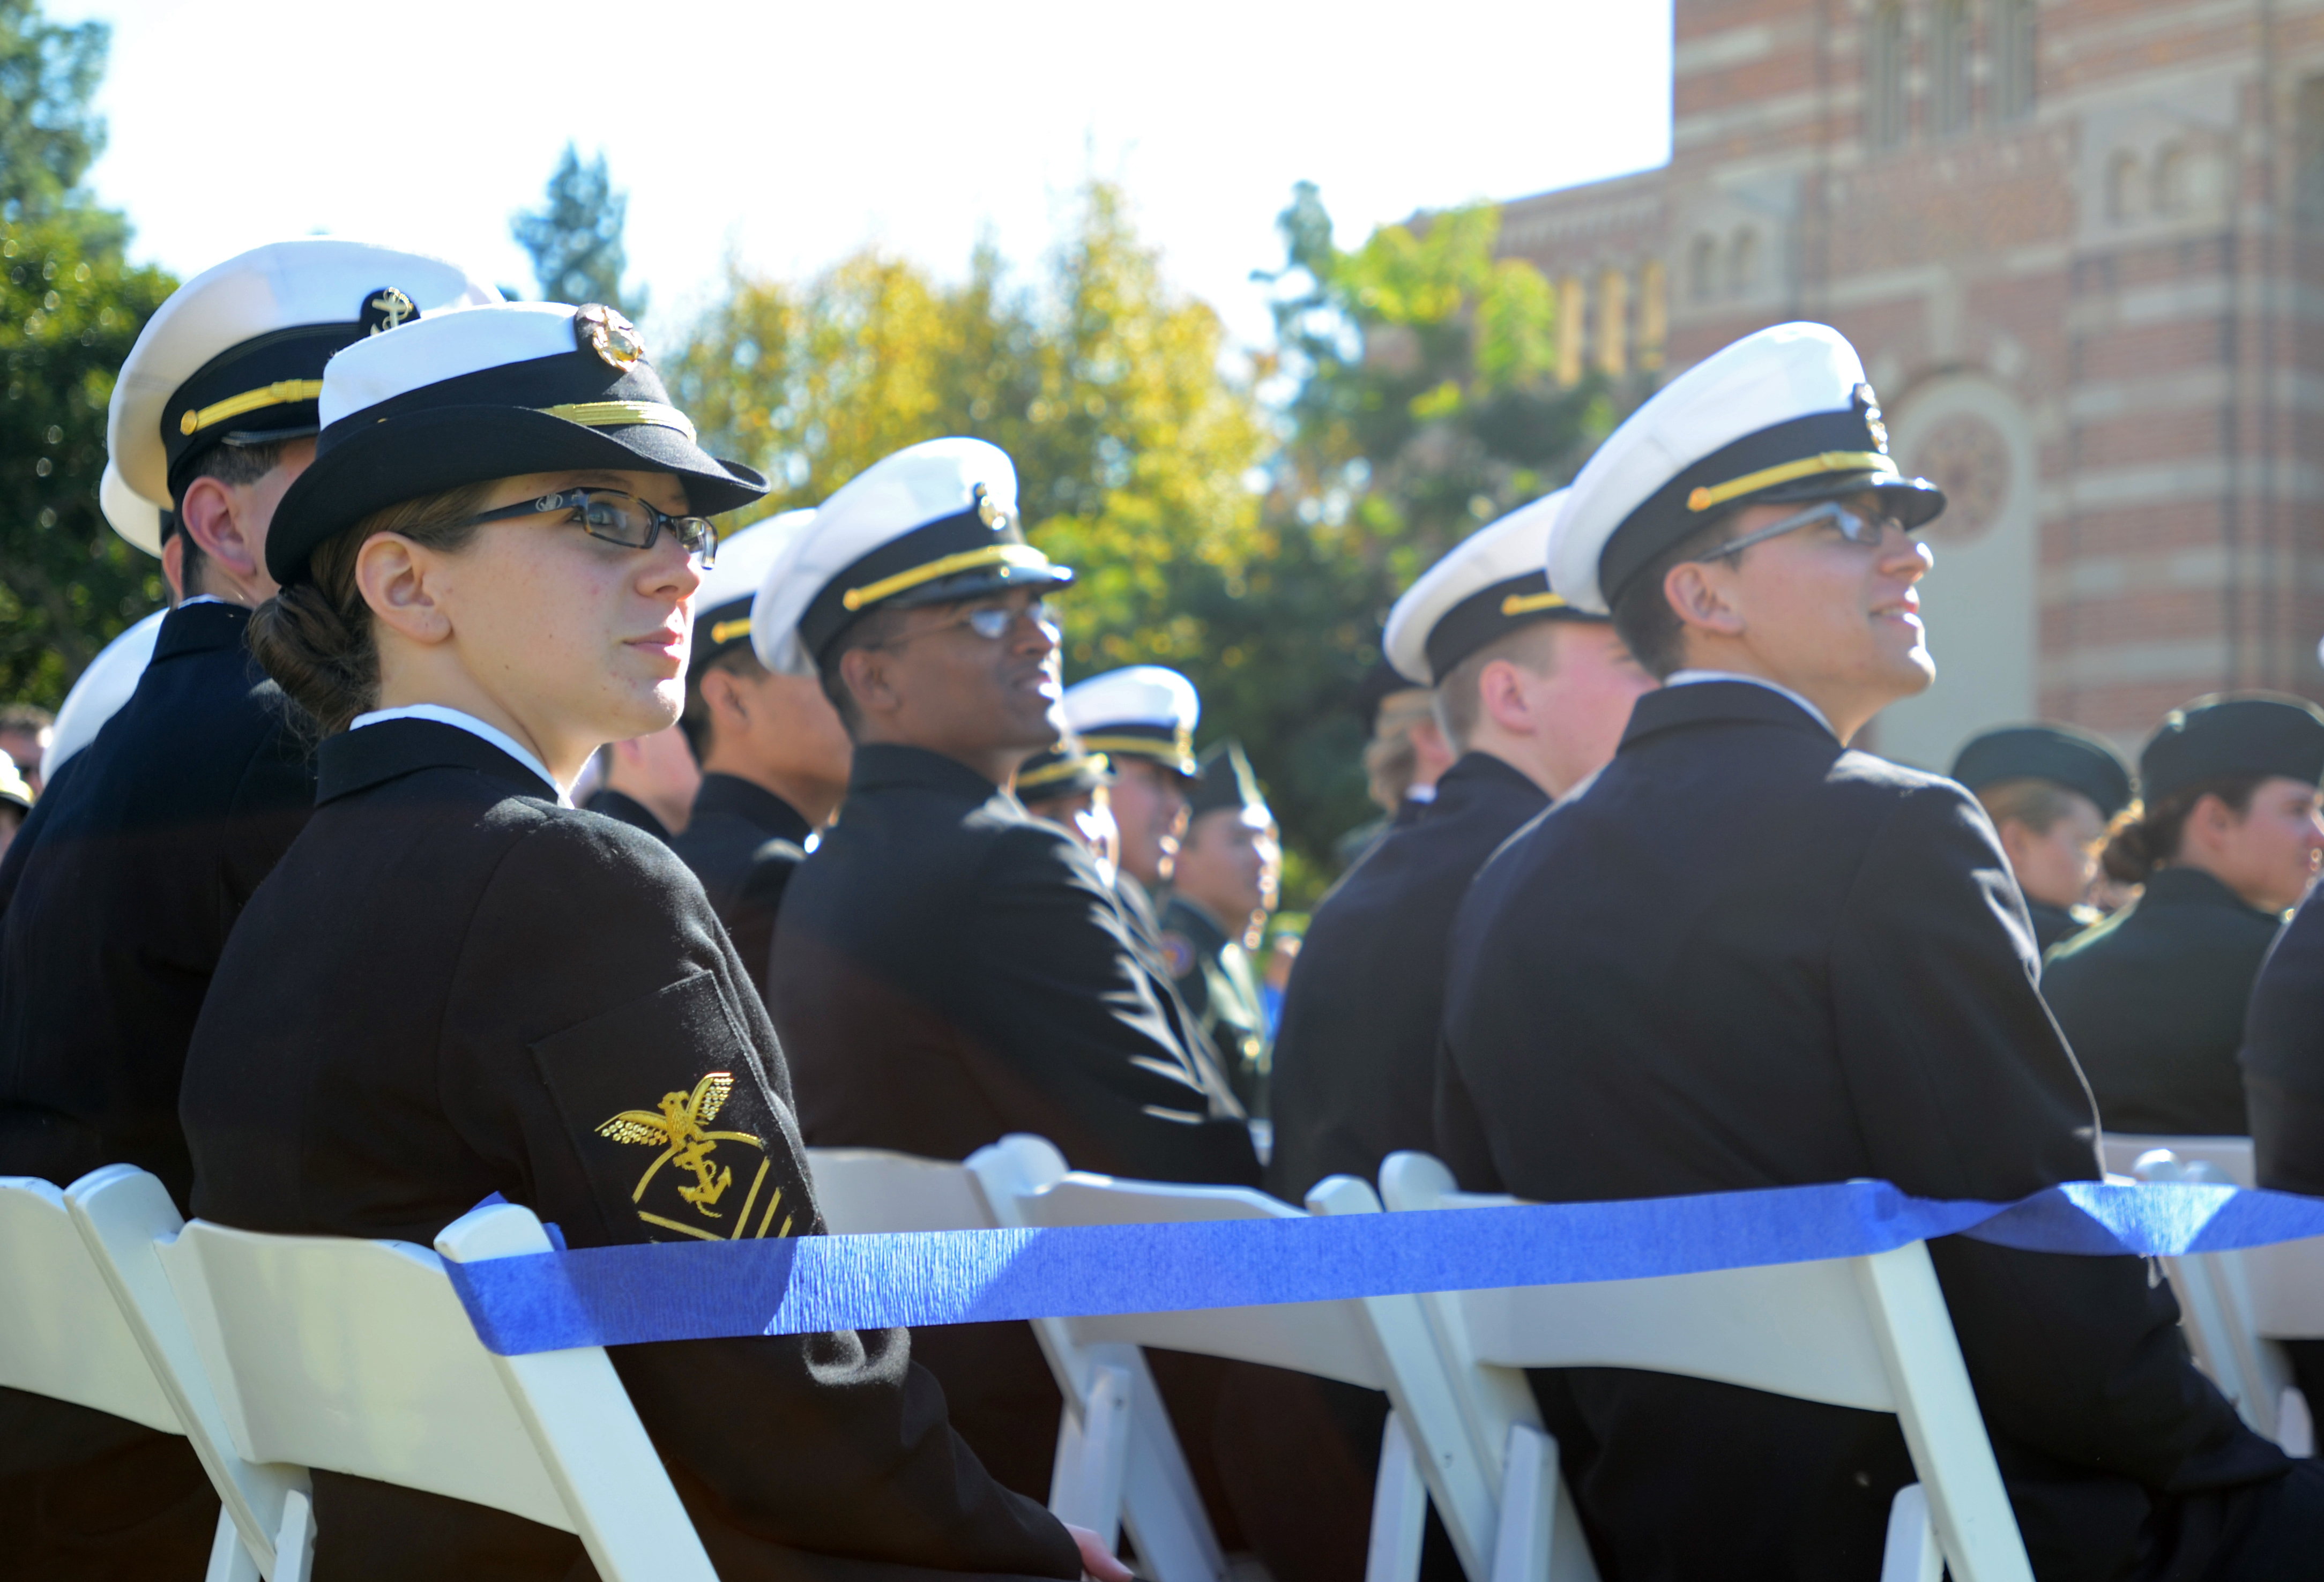
UCLA, Chancellor Block seeks to foster student veterans
Chancellor Gene Block announced a new initiative last week to help increase public understanding of veterans issues as members of the armed forces return home from overseas deployment. Read more...
Photo: The UCLA Veterans Initiative, which was announced by Chancellor Gene Block last week, aims to increase the visibility of student veterans on campus by educating the UCLA community about veterans issues and highlight the services that UCLA already offers for student veterans.
Campus, News
|
April 9, 1:11 am
SWANA proposal under review by UC
The University of California is currently reviewing a proposal to add a checkbox on its application to allow applicants to identify as Southwest Asian or North African. Read more...
Campus, News
|
April 8, 1:16 am
USAC Election Board extends application deadline for prospective candidates
The original version of this article contained multiple errors and has been changed. See the bottom of the article for additional information. The Undergraduate Student Association Council Election Board has extended the deadline to apply for candidacy for the upcoming elections to Tuesday, after there was confusion over two dates listed as deadlines in the candidate application packets. Read more...
Campus, News
|
April 8, 1:15 am
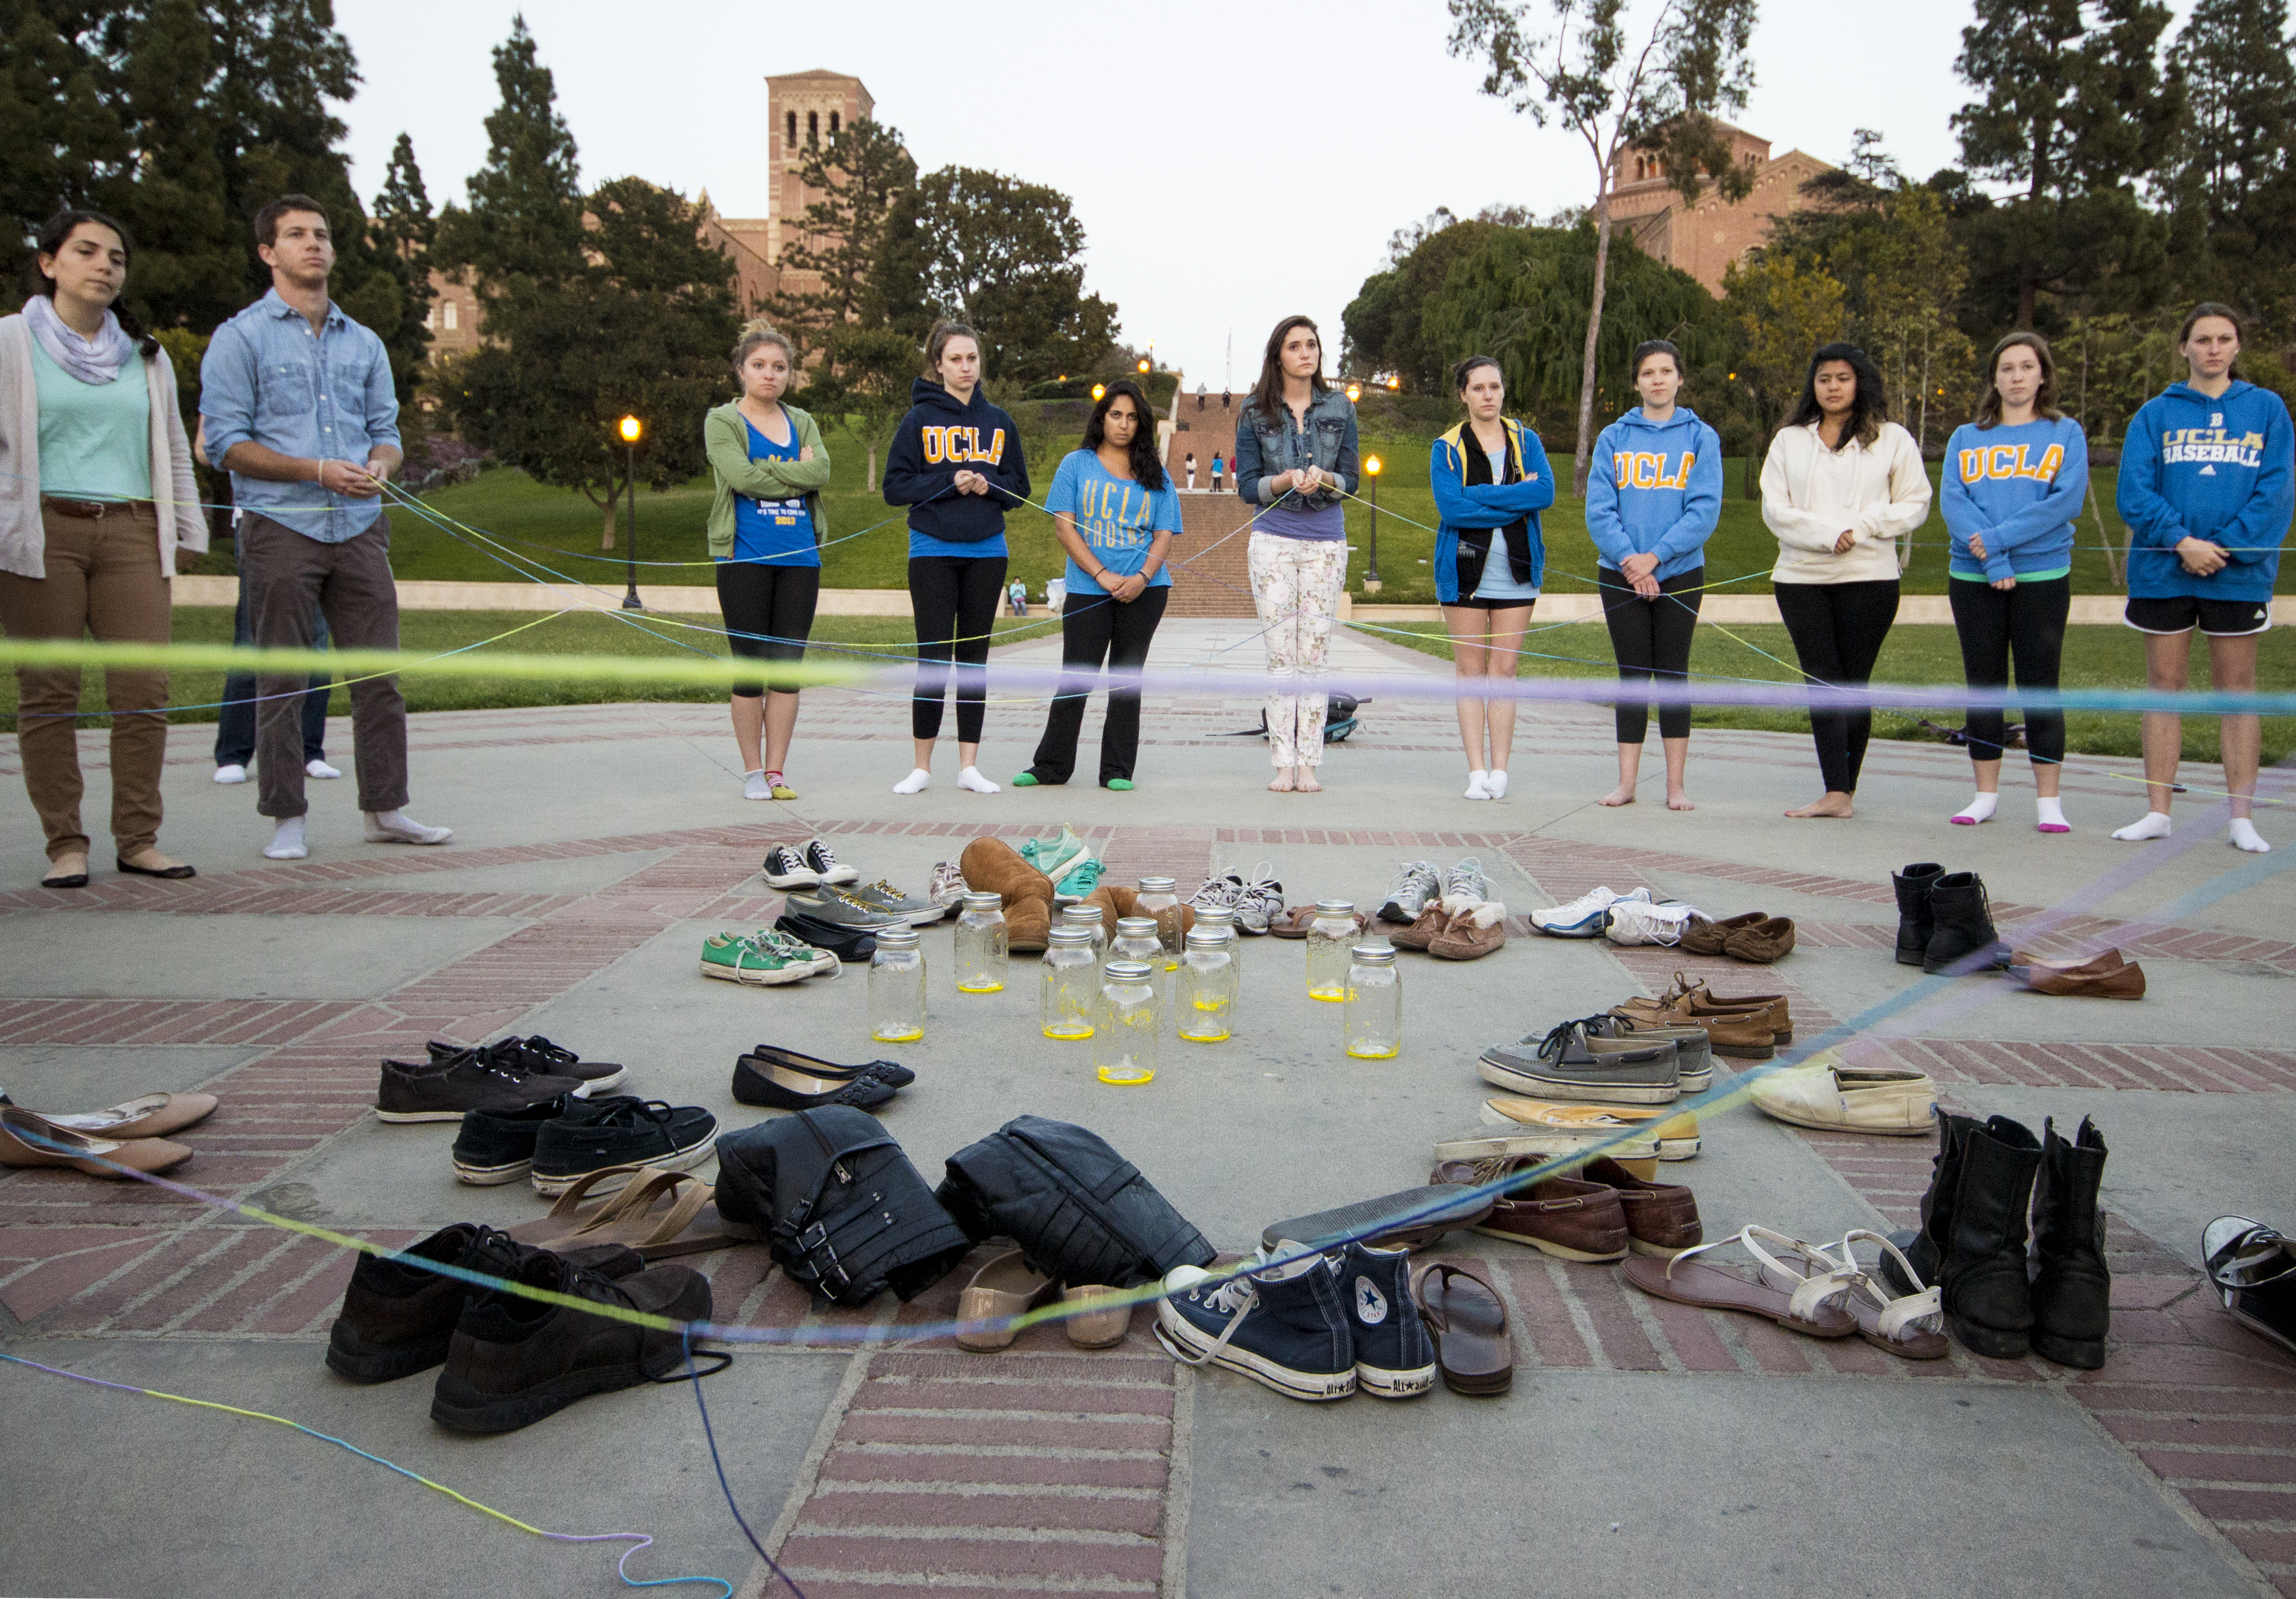
Bruins honor the memory of victims on Holocaust Remembrance Day
Dozens of empty shoes lie strewn around 11 empty jars, 11 jars in memory of the nearly 11 million people killed during the Holocaust. Read more...
Photo: Students stand around a circle of shoes surrounding 11 jars representing the nearly 11 million people killed in the Holocaust. The ceremony, which took place Sunday night, is part of Holocaust Remembrance Day. The event was organized by the student group Bearing Witness.
Campus, News
|
April 8, 1:07 am
Graduate students to vote on candidates, ballot referendums
For the second year in a row, only one candidate is running for each of the four Graduate Student Association positions – president, vice president of internal affairs, vice president of external affairs and vice president of academic affairs. The ballot also includes an advisory referendum and a fee referendum. Read more...
Campus, News
|
April 5, 2:22 am
Report says tuition hikes unsustainable, proposes methods to reform funding
For the past several years, the University of California has experienced a dynamic of sharp state budget cuts that have been absorbed primarily by increasing tuition – a funding model that a recent report says is unsustainable. Read more...